3.1. Log Search
Logs are the information that Motadata collects from your network and display in a meaningful format. Here you can search and view the logs that are used by Motadata.
Prerequisites: Motadata server has following dependencies for the logs menu:
License: Your Motadata license counts the data used to download/view the logs.
Plugins required: Universal Log Parser
Log engine should be ON from back-end.
‘Full Text Search’ should be on (Admin > Global Settings Click Here)
How this search works?
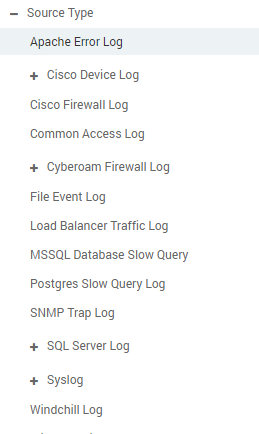
On this screen, from the left side you’ll select the source type (or child of the source type). You can enable/disable the source types from admin section. Click Here for more information.
In case if the source type is disabled from the admin section, the logs will appear under ‘Other’ source type.
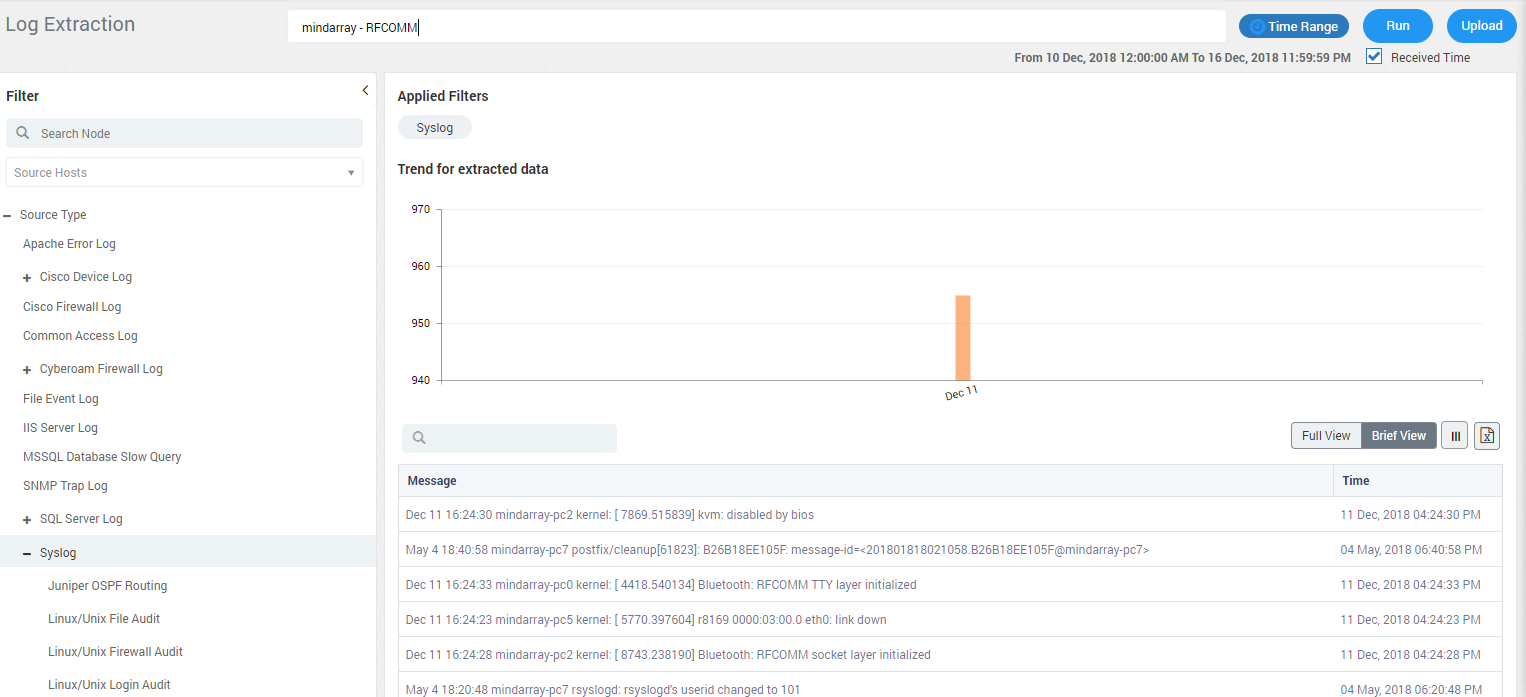
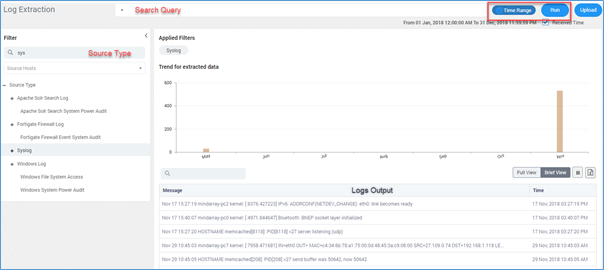
On the top, you’ll type the query and select the time range.
When you’ll run the search, system will show you the logs and a graph of log trends.
The graph shows the logs extracted from your system into Motadata. The trend is based on the time range of logs and gives you the log count for each artifact of time.
Messages will show you the details of each log. The details include message, time, received time etc.
Motadata Log Search
3.1.1. Search Query Paramters
3.1.1.1. Search Everything
If you visualize each and every raw log, type ‘*’ in the search box.
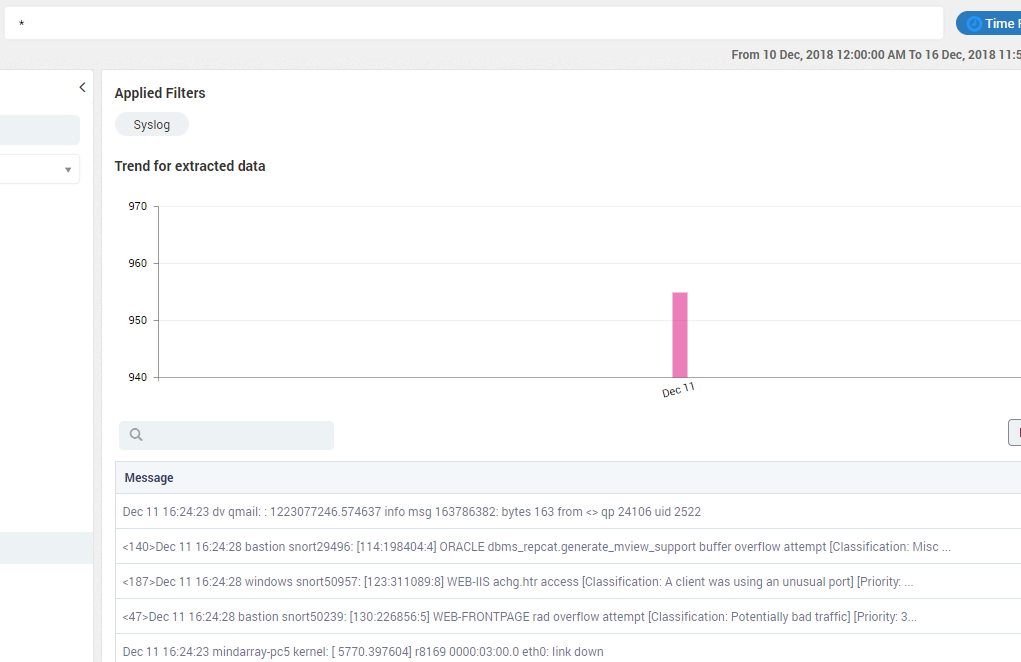
Search Anything - Everything
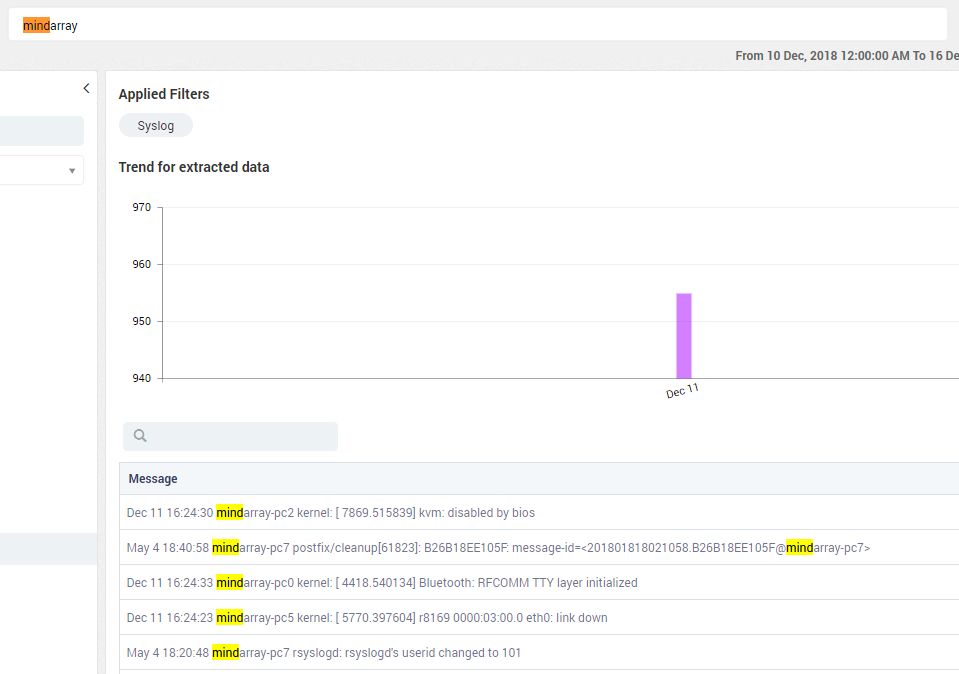
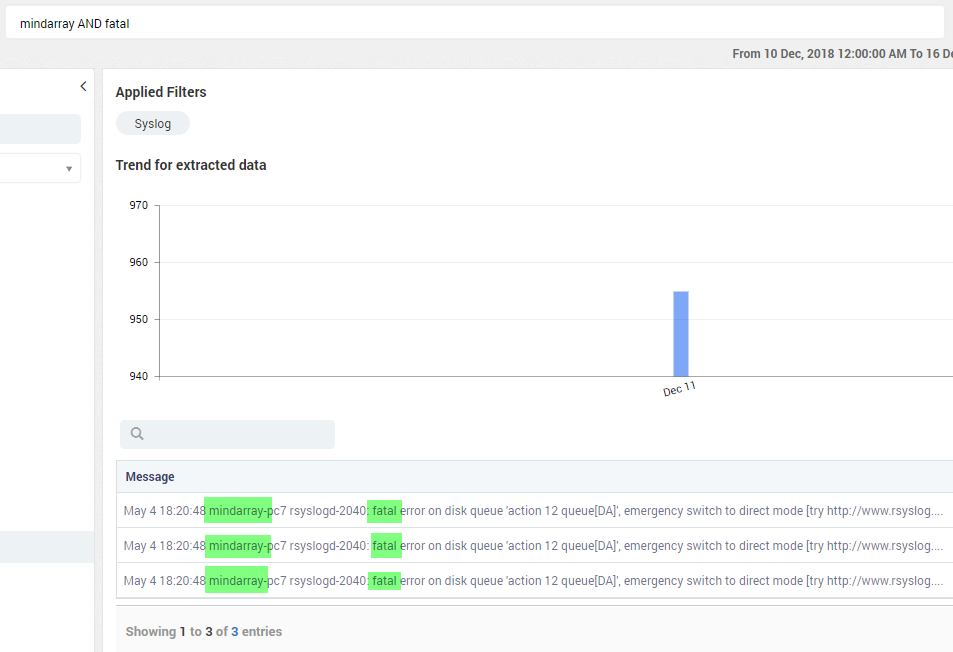
Motadata has custom query syntax for querying its indexes like following:
3.1.2. Filter Search
You can filter the raw log search data by sorting on the basis of:
Source Host: The source from where the logs are generated.
Source Type: The types of the source.
Filter Search
Time Range: The time duration for which you want to search the log.
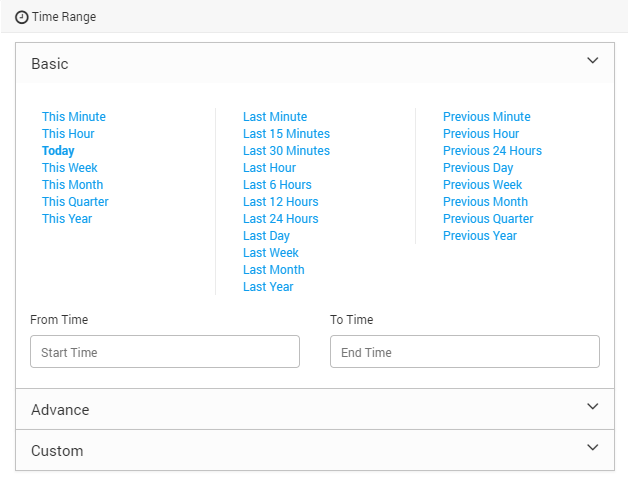
Time Range
3.1.3. Run
Click on the run button to see the logs. This action uses source type (see extreme left), source host, search query and time range values to filter and show logs.
The received checkbox decides which time-frame should be used to show logs. If it is true, system will show the logs only when their ‘received time’ falls in the time frame. If it is false, you’ll see the logs when they were actually generated (irrespective of when they came in Motadata). For the logs that you upload, the ‘received time’ is the time when you upload the logs in the Motadata. hence to see old logs, search them by their received time (upload date-time).
Click Run to See Logs
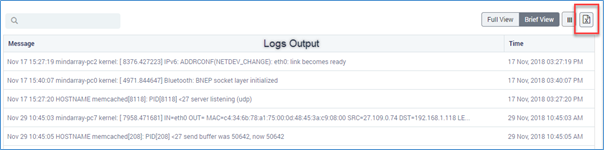
You’ll see the log results in the tabular format. By default we show two columns: Message and Time. Other columns are hidden by default. Click on the  icon to see the list of all columns.
Source Host |
The source IP address on which log is recorded |
Source Type |
The place where log is generated |
Data Model Name |
The name of the data model where log is recorded. The data model is a term associated with database |
Message |
The log message recorded |
Received Time |
The time at which log was recorded |
Time |
The time at which log was generated |
Severity |
Severity of the error recorded in log |
Process ID |
The process ID associated with log |
Thread ID |
The thread ID associated with log |
Source City |
The name of the city where log is generated |
Source Latitude |
The geographical latitude coordinates |
Source Country |
The name of the country where log is generated |
Source Longitude |
The geographical longitude coordinates |
Source Port |
The port number of device/source where log is generated |
Module Name |
The name of the module associated with the log |
Source IP |
The IP address of the source/device where log is generated |
3.1.4. Full View & Brief View
Full View: Shows the full log message. This is helpful when you want to see complete details of log message.
Brief View: Shows the trimmed log message. This is helpful when you want to identify the required log by quickly looking at the messages.
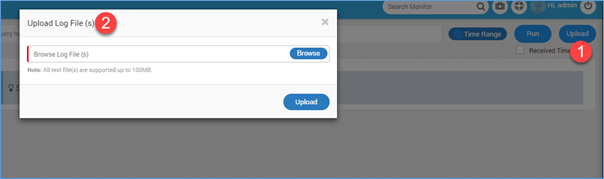
3.1.5. Upload
You can upload your logs in Motadata using Upload button. It will open a popup for you to select the file. Motadata will take some minutes to reflect the data of uploaded file.
Back-end Prerequisites
We need below settings so Motadata can parse the uploaded logs and save in Clickhouse database. Motadata uses an agent that understands the uploaded files and convert them into a meaningful data.

* In /motadata/motadata/config/motadata-conf.yml -> motadata-agent: yes
* In /motadata/motadata/log-watcher-service.yml -> log-dirs: "/motadata/motadata/uploaded-log" (Provide the path where logs will be uploaded. This is the default path)
* In /motadata/motadata/agent.yml -> motadata-server-port: 5142 (Provide the port value. This is the default port)
* In /motadata/motadata/agent.yml -> motadata-server-host: localhost (Provide the host value. This is the default host)
* In /motadata/motadata/config/motadata-conf.yml -> motadata-agent: yes (Motadata agent should be set as: "yes")
Upload Logs in Motadata
3.1.6. Export
Click on the export button to export the logs. Exporting to CSV will result in following format:
Data Rows are less than 100001 – Motadata will create a CSV file and download on your local machine.
Data Rows are greater than 100000 – Zip file having CSV will be created. Each CSV will store 100,000 logs. The zip will is stored in Motadata server. If you have created the zip file, you’ll get email about the path of zip file in server. You should have access to back-end to see the file.
// Path of zip file

cd /motadata/motadata/report
Note: You have to run log generator for each source type separately.
Export logs option in logs output
3.1.7. Viewing the log data in widgets
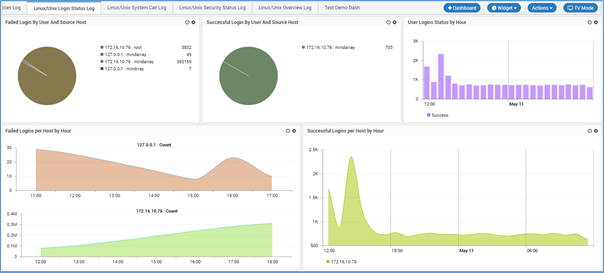
Navigate to dashboards (Click Here) tab and select any category to view the widgets. Here filter the dashboard to show logs. For example, search ‘Login Status Log’. You can also create your own log widgets. With custom widget you can use your custom queries to generate an output.
Linux/Unix status log gives the information about the log in actions like successful logins or failed logins. The logs enlisted in the search module are in the raw format. The below screenshots show the same data of the logs displayed per hour.
View Log Data in Widgets
3.1.8. Log Details in Widget
The widget shows the graph for:
Failed Login by User and Source Host
Successful Login by User and Source Host
User Logins Status by Hour
Failed Logins per Host by Hour
Successful Logins per Host by Hour